927880-90-8
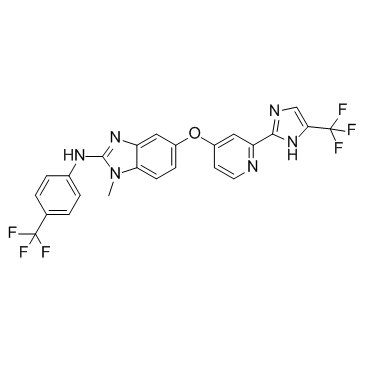
| Name | 1-methyl-5-[2-[5-(trifluoromethyl)-1H-imidazol-2-yl]pyridin-4-yl]oxy-N-[4-(trifluoromethyl)phenyl]benzimidazol-2-amine |
|---|---|
| Synonyms |
,CHIR-265,,CHIR265
RAF265(CHIR-265) {1-Methyl-5-[2-(5-trifluoromethyl-1H-imidazol-2-yl)-pyridin-4-yloxy]-1H-benzoimidazol-2-yl}-(4-trifluoromethylphenyl)-amine 1-Methyl-5-[[2-[5-(trifluoromethyl)-1h-imidazol-2-yl]-4-pyridinyl]oxy]-n-[4-(trifluoromethyl)phenyl]-1h-benzimidazol-2-amine {1-methyl-5-[2-(5-trifluoromethyl-1H-imidazol-2-yl)-pyridin-4-yIoxy]-1H-benzoimidazol-2-yl}-(4-trifluoromethyl-phenyl)amine 1H-Benzimidazol-2-amine, 1-methyl-5-[[2-[5-(trifluoromethyl)-1H-imidazol-2-yl]-4-pyridinyl]oxy]-N-[4-(trifluoromethyl)phenyl]- CHIR265 1-Methyl-5-({2-[4-(trifluoromethyl)-1H-imidazol-2-yl]-4-pyridinyl}oxy)-N-[4-(trifluoromethyl)phenyl]-1H-benzimidazol-2-amine RAF265 1-methyl-5-(2-(5-(trifluoromethyl)-1H-imidazol-2-yl)pyridin-4-yloxy)-N-(4-(trifluoromethyl)phenyl)-1H-benzo[d]imidazol-2-amine |
| Description | RAF265 is a potent RAF/VEGFR2 inhibitor. |
|---|---|
| Related Catalog | |
| Target |
VEGFR2 RAF |
| In Vitro | The MTT assay reveals that in HT29 and MDAMB231 cells, RAF265 alone shows significant activity with IC20 values of 1 to 3 μM and IC50 values of 5 to 10 μM. In A549 and HCT116 cells, IC20 values are 1 μM for both, but RAF265 concentrations up to 10 μM do not reach IC50 values. However, in the presence of 1 nM RAD001, the IC50 for RAF265 is 5 μM in A549 cells and 10 μM in HCT116 cells[1]. |
| In Vivo | In single-compound efficacy studies, optimal dosing of RAD001 and RAF265 is 5 to 12 mg/kg daily and 30 mg/kg every two days, respectively. However, combination tolerability studies in nontumor-bearing mice defin dose-limiting toxicity as a 10% weight loss with the combination of RAD001 at a dose of 12 mg/kg daily and RAF265 at a dose of 20 mg/kg every two days. Therefore, the combination of RAF265 at a dose of 12 mg/kg qd and RAD001 at a dose of 12 mg/kg qd seems to be the maximal tolerated dose. RAD001 and RAF265 are both given at a dose of 12 mg/kg qd, alone or concurrently, over 6 days. After a 2-day stop, the compounds are given for another 6 days, and the treatment is then stopped. To confirm the potential of the combination of RAF265 and RAD001, the antitumor effect of the combination is tested in HCT116 xenografts (KRAS mut, PIK3CA mut). In HCT116 xenografts, RAD001 or RAF265 given alone shows 60% to 65% and 71% to 72% TVI%, respectively[1]. |
| Cell Assay | The MTT assay and Bliss additivism model are used to assess the effect of the combination on cell viability. Human A549 and H460 lung, HT29 and HCT 116 colon, and MDAMB231 breast cancer cell lines are used. In each well of a 96-well plate, 1×10⁴ cells are grown in 200 μL of medium. After 24 h, RAD001, RAF265, or the combination is added to achieve a final concentration of 0.1 to 10 nM and 0.1 to 10 μM, respectively. After 48 h of treatment, 20 μL of 5 mg/mL MTT solution in PBS is added to each well. After 4 h, supernatant is removed and formazan crystals are discarded in 200 μL of DMSO. Absorbance is then measured at 595 nm using an absorbance plate reader. Data are expressed as the percentage of viable cells in treated relative to nontreated conditions[1]. |
| Animal Admin | Mice[1] The efficacy of the combination is also tested in vivo. A total of 3×10⁶ A549, H460, HCT116, or MDAMB231 cells are injected s.c. into the flank region of 6-wk-old female athymic mice. When tumors reach 50 mm3, the mice are randomized into four groups (n=7/group) for the following treatment: vehicle, RAF265 (12 mg/kg daily), RAD001 (12 mg/kg daily), or both. All drug are administered over 14 d (6 d on, 2 d off, 6 d on), and the drug combination is administered concurrently. Control mice receive the respective vehicles of both drugs. Animal weight and tumor volumes are taken twice weekly and expressed relative to initial tumor volume. Tumors are measured until achieving a relative volume of 10 times the initial volume, and the time to this end point is noted. Drug efficacy is assessed based on the tumor growth curve, growth delay, and tumor volume inhibition percentage. The tumor growth curve is designed to depict the evolution of the relative tumor size over time. The tumor volume inhibition percentage (TVI%) is calculated[1]. |
| References |
| Density | 1.5±0.1 g/cm3 |
|---|---|
| Boiling Point | 667.6±65.0 °C at 760 mmHg |
| Molecular Formula | C24H16F6N6O |
| Molecular Weight | 518.414 |
| Flash Point | 357.5±34.3 °C |
| Exact Mass | 518.128967 |
| PSA | 80.65000 |
| LogP | 6.03 |
| Vapour Pressure | 0.0±2.0 mmHg at 25°C |
| Index of Refraction | 1.622 |
| Storage condition | -20℃ |
|
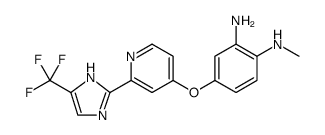
~62% 
927880-90-8 |
| Literature: Novartis AG Patent: US2007/49622 A1, 2007 ; Location in patent: Page/Page column 41 ; |
|
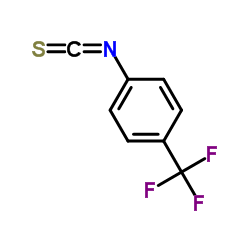
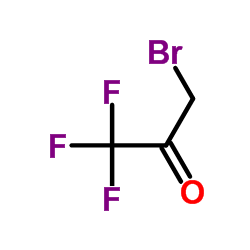
~21% 
927880-90-8 |
| Literature: Novartis AG Patent: US2007/49622 A1, 2007 ; Location in patent: Page/Page column 44 ; |
| Precursor 3 | |
|---|---|
| DownStream 0 | |


